How to Calculate Exact Risk-to-Reward Ratio and Flatten Your Equity Drawdowns
Taking high-risk options trades on Nifty without a clear risk-to-reward strategy is a guaranteed path to account depletion. Learn how automated trade tracking smooths your equity curve across Indian brokers.
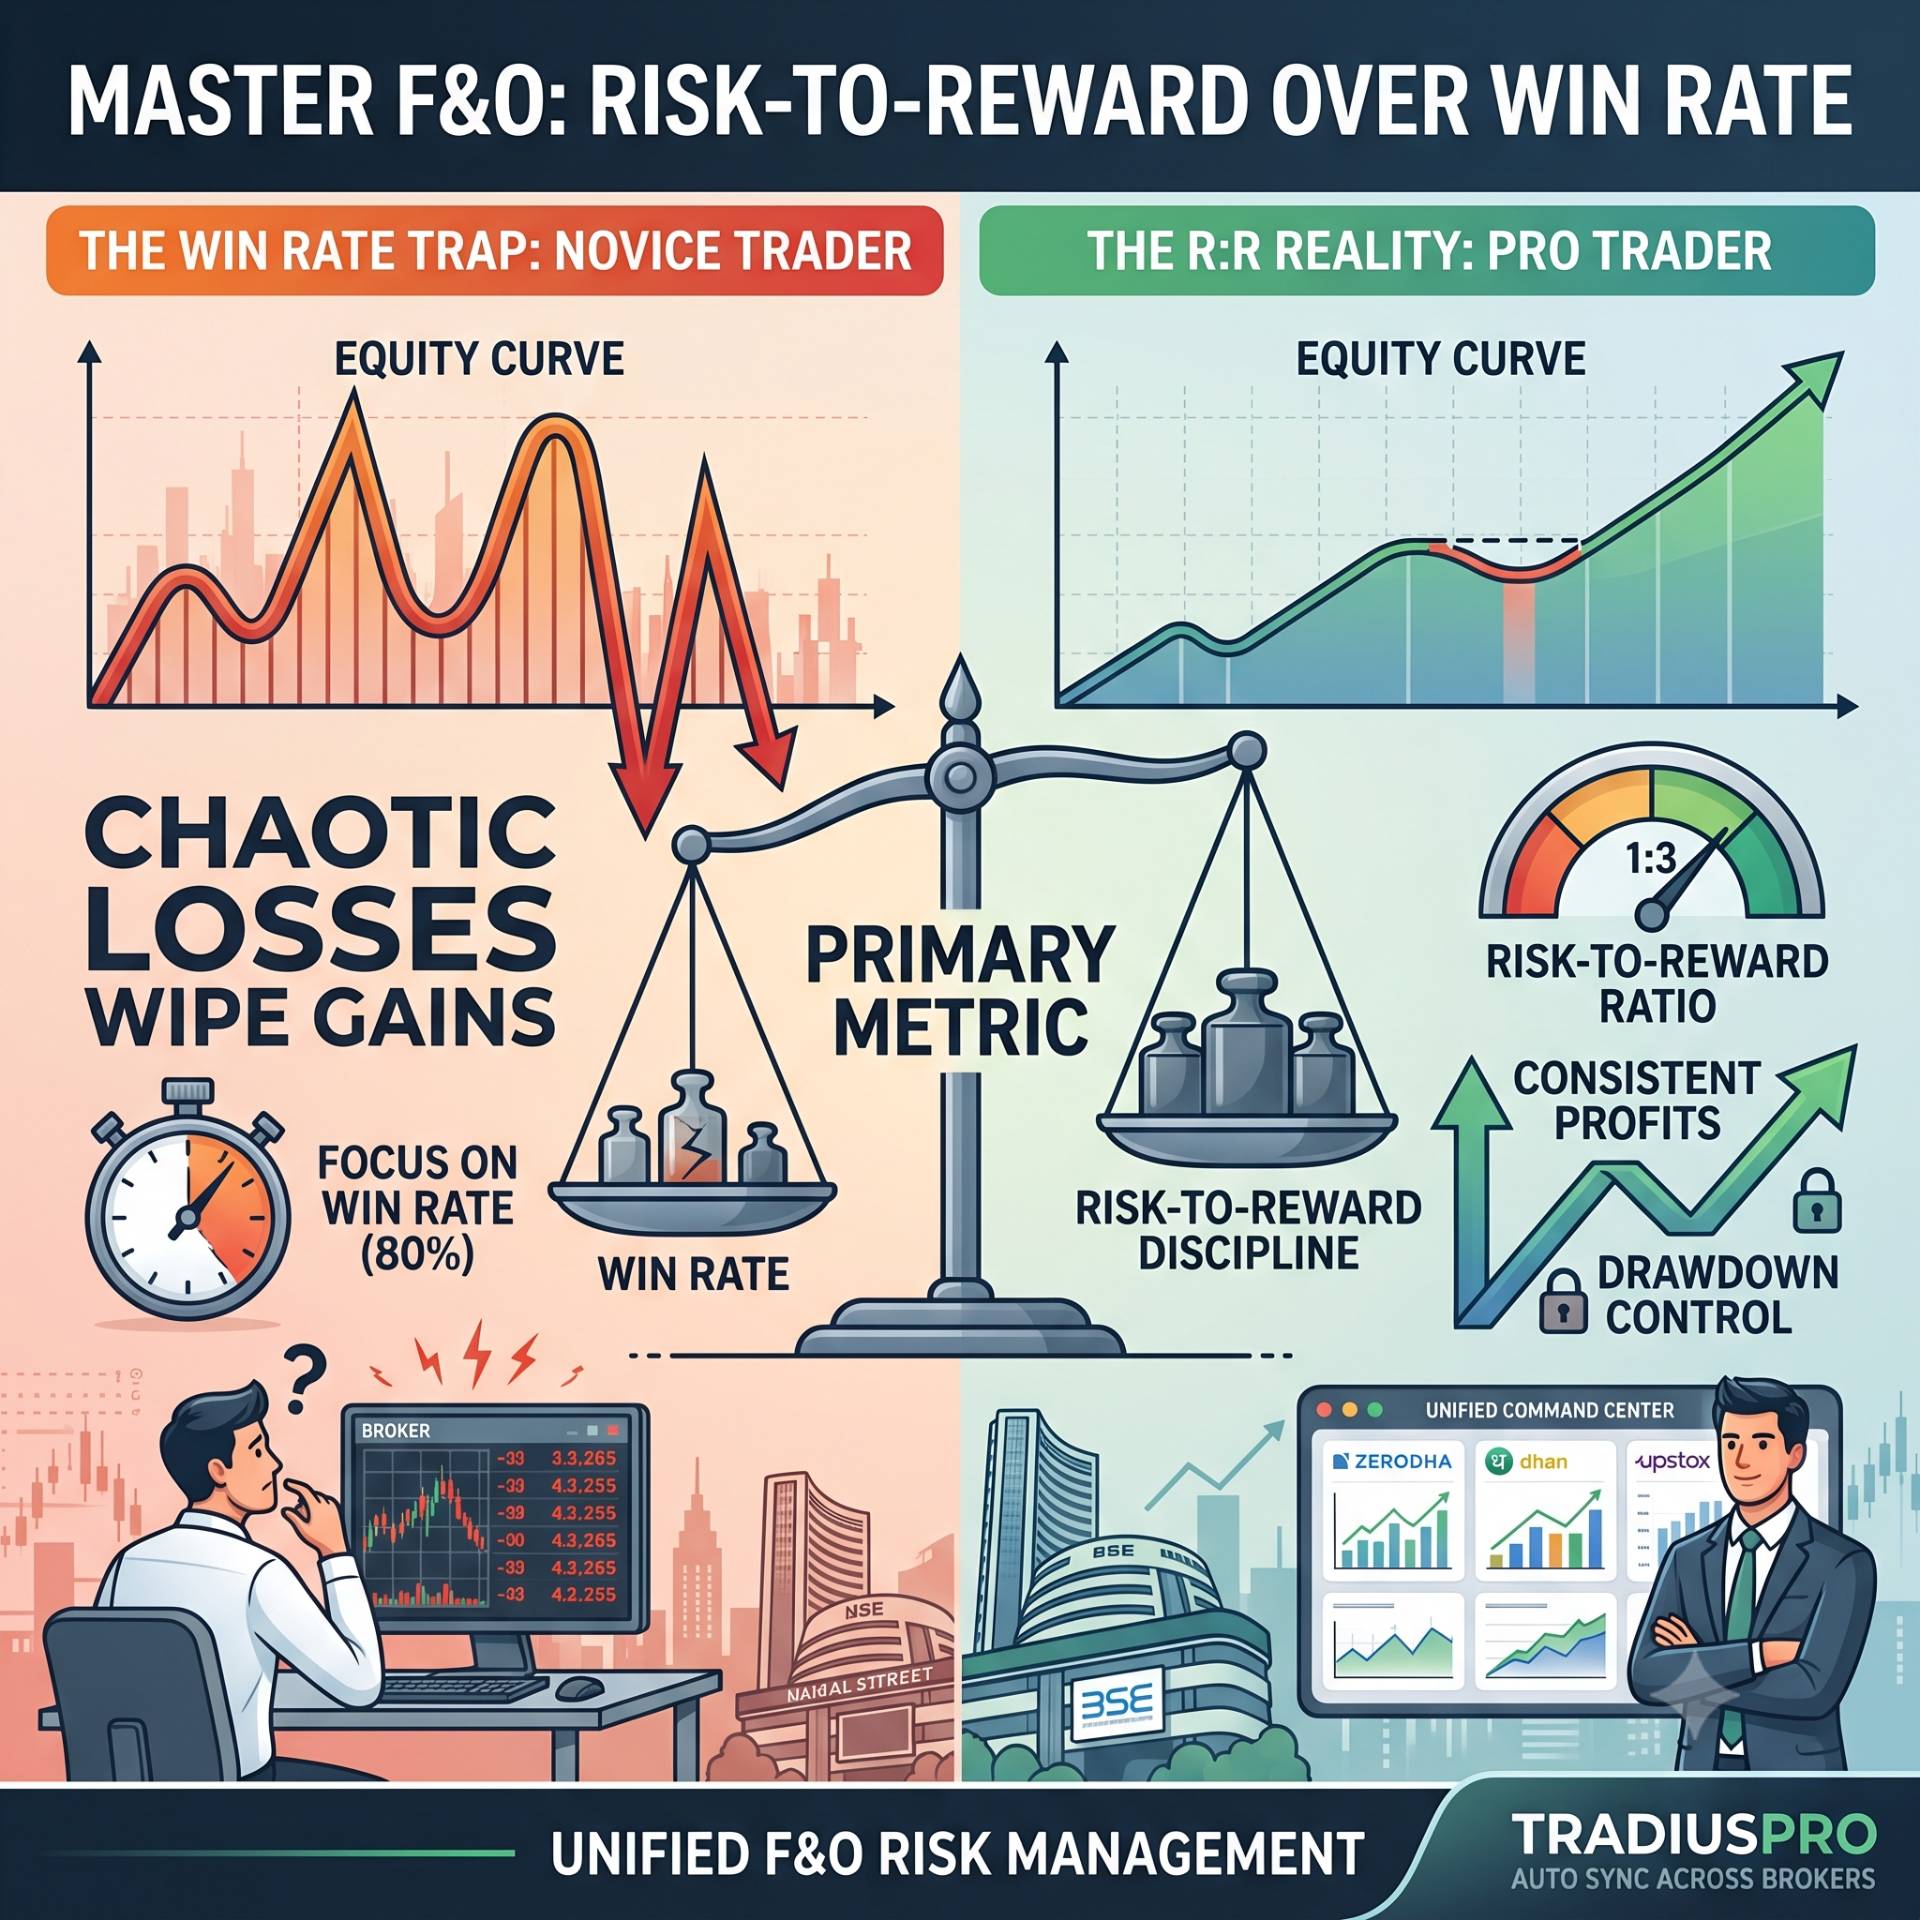
Table of Contents
Scanning sections...
Ask any novice trader on Dalal Street what their goal is, and they will tell you they want a 80% win rate. Ask a seasoned, consistently profitable Futures and Options (F&O) trader, and they will tell you win rate is secondary—their primary focus is risk-to-reward (R:R) discipline and drawdown control.
You can have a 40% win rate trading Nifty 50 or BankNifty options and still print massive profits every month if your average win is three times larger than your average loss. Conversely, an 80% win rate will still blow up your account if your single losing trade wipes out ten previous winning sessions.
If you want to survive the Indian derivatives market long-term, you must stop focusing on P&L euphoria and start treating your risk-to-reward ratio as your primary operational metric.
The Realized vs. Intended Risk-to-Reward Fallacy
When you place an order on your broker terminal, you usually have an intended setup in mind: "I am risking 15 points on BankNifty to make 45 points." This gives you an intended 1:3 risk-to-reward ratio.
In live execution, however, psychological friction and execution reality take over.
You see a quick ₹1,000 profit and panic, exiting early for a 10-point gain. Later in the session, a trade moves against your planned 15-point stop-loss, but you hold on out of hope, eventually exiting for a 30-point loss. Your intended 1:3 ratio just mutated into a realized 0.33:1 negative ratio.
If you only track gross entry and exit prices in a manual spreadsheet, you cannot measure this execution decay. You need a specialized F&O trade tracker that calculates the exact difference between what you planned to do and what you actually executed.
Visualizing Your Equity Curve to Spot System Failure
Numbers in a table can easily hide dangerous behavioral patterns. A trader might look at a net positive monthly P&L and assume their strategy is healthy. However, a visual trade equity curve analyzer tells a very different story.
If your equity curve looks like a roller-coaster—sharp upward spikes followed by violent downward drops—your risk management is fundamentally broken. You are relying on aggressive position sizing or lucky winning streaks rather than a consistent, positive mathematical expectancy.
A smooth, upward-sloping equity curve is built on consistent risk parameters. When your losses are strictly capped at 0.5% or 1% of your total trading equity, losing streaks show up as minor, horizontal compressions on your curve rather than unrecoverable craters.
Multi-Broker Risk Synchronization across Zerodha, Dhan, and Upstox
Managing risk becomes twice as complex when your capital is split across multiple execution terminals. Many active traders in India execute high-frequency options scalps via Dhan or Upstox for their advanced charting tools, while keeping longer-term position trades on Zerodha or Nuvama.
Attempting to calculate your aggregate daily risk across different broker platforms manually leads to mathematical errors and missed rule breaches. You need a unified dashboard that ingests your raw tradebooks from all sources simultaneously.
By deploying TradiusPro as your central risk command center, you eliminate data fragmentation. Utilizing the Dhan broker trading journal auto sync alongside Upstox and Zerodha CSV parsing allows the platform to consolidate your total daily exposure instantly. (And if you also trade global macro pairs or prop firm evaluations on MetaTrader 5, TradiusPro seamlessly unifies your global risk alongside your domestic F&O accounts).
Automating Your Risk Audit
The fastest way to fix your risk management is to let software perform the audit for you.
When you import your execution history into TradiusPro, the platform automatically calculates your true realized R:R distribution, tracks your Maximum Adverse Excursion (MAE), and plots your live equity curve. You can immediately isolate which setup types generate clean 1:2+ returns and which emotional habits are causing your drawdowns.
Stop trading in the dark. Sync your broker accounts into TradiusPro, measure your realized risk-to-reward ratio, and build an equity curve that reflects true professional consistency.