Technicals vs. Execution: Why Your Charts Are Right but Your P&L is Red
You predicted the breakout, marked the support, and knew the target. So why did you lose money? We explore the critical gap between Technical Analysis and Execution, and how to fix it using your Zerodha or Dhan trade data
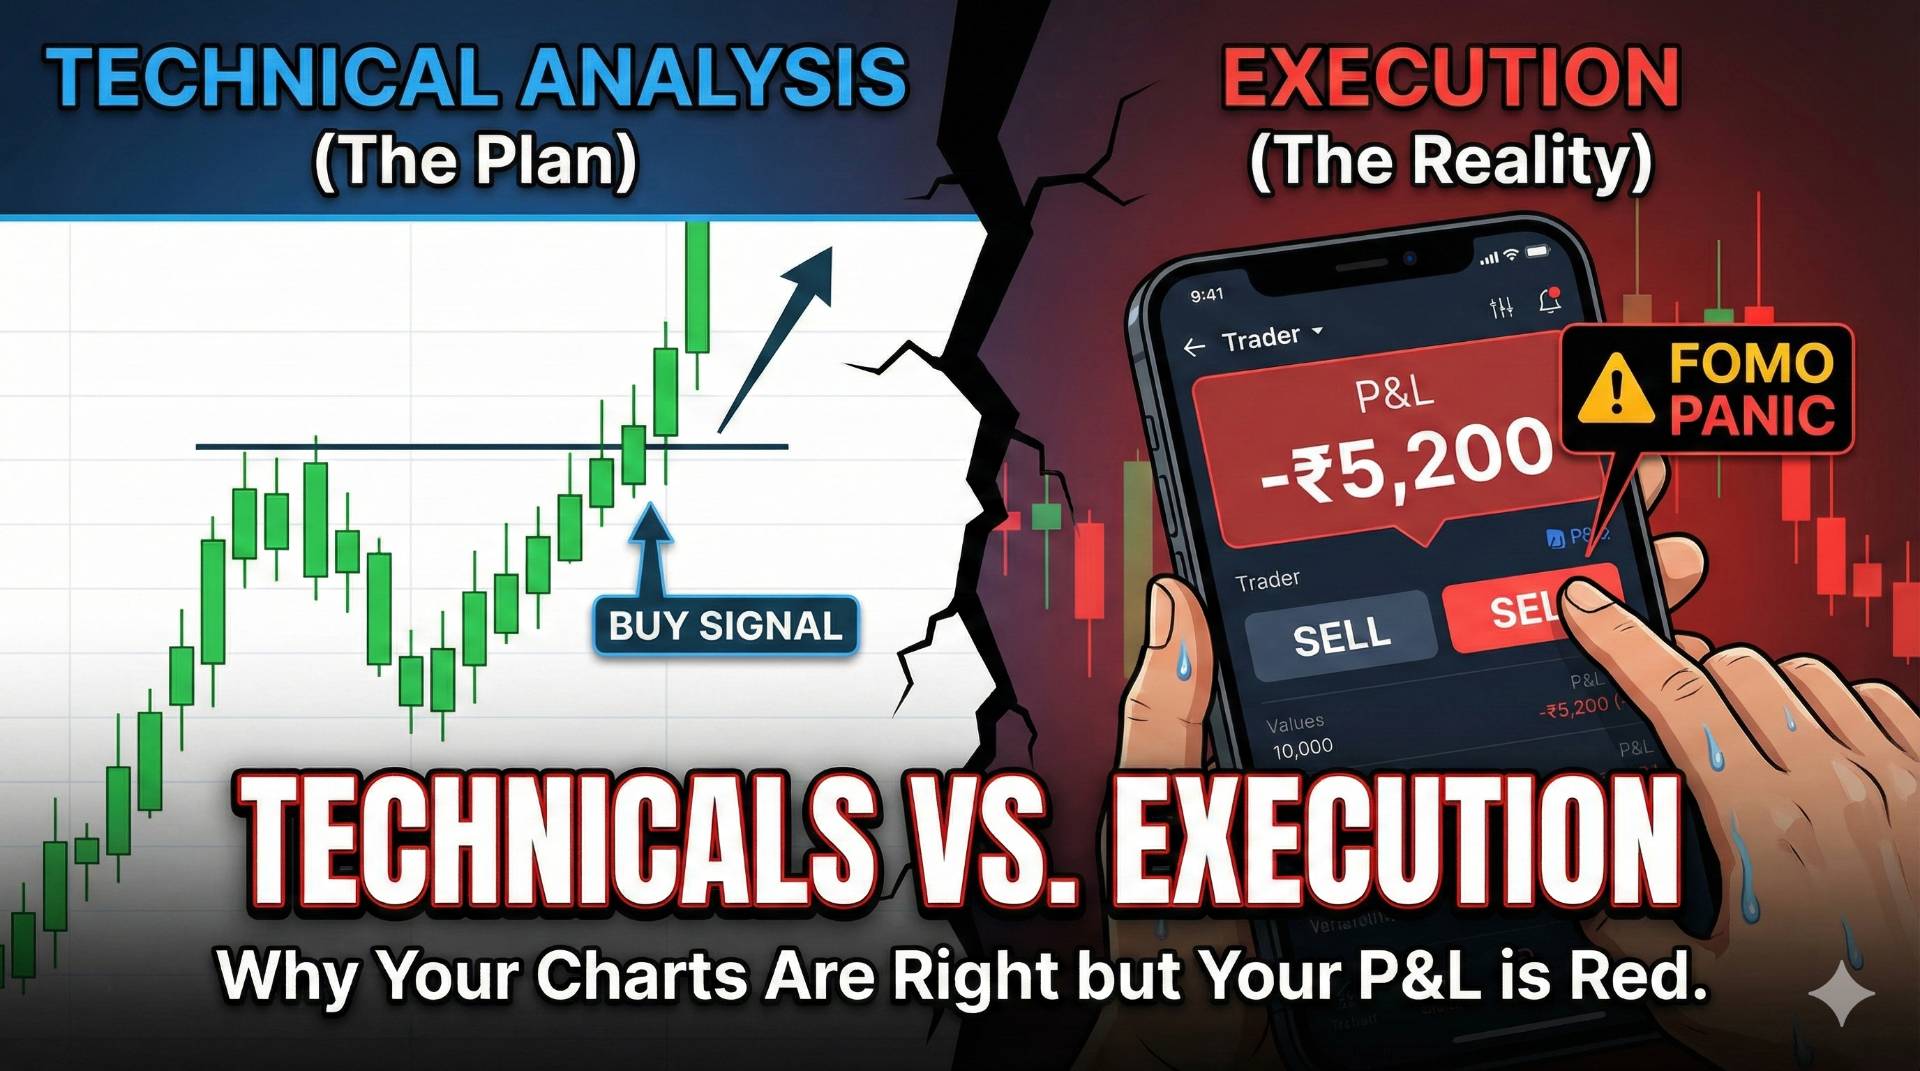
Table of Contents
Scanning sections...
The "I Knew It!" Syndrome
We have all been there. You spend Sunday night marking up charts. You identify a perfect Inverse Head and Shoulders pattern on Nifty or a clean breakout setup on a Reliance chart.
Monday morning comes. The market moves exactly as you predicted. The target is hit.
But when you look at your P&L, it’s red. Or worse, it’s empty because you hesitated and didn't take the trade.
This is the "Execution Gap." In trading, being right about the direction (Technical Analysis) is only 20% of the battle. The other 80% is execution (Trading Psychology).
Here is how to bridge that gap using data, not just feelings.
1. The Technical Reality Check: Are You Trading the Chart or Your P&L?
Technical analysis works on probabilities, not certainties. However, Trading Psychology often tricks us into trading our P&L instead of the chart.
- The Technical Signal: Price retested the 200 EMA and formed a bullish hammer.
- The Psychological Error: You entered late because of FOMO, or you exited early because you saw a ₹2,000 profit and got scared to lose it, even though the chart said "hold."
The Fix: You need to separate the Setup from the Outcome. In your Trading Journal, you must log the specific technical trigger for entry (e.g., "RSI Divergence"). Then, review: Did you exit because the technical structure broke, or because you were scared?
2. Your Broker Data Holds the Truth (Zerodha & Dhan Users)
Most Indian traders use platforms like Zerodha or Dhan for their excellent execution speeds. But are you using the data they generate?
Your Contract Note is not just a receipt; it is a crime scene investigation.
By importing your tradebook from Zerodha or Dhan into TradiusPro, you can visualize technical leakage:
- Slippage Analysis: Are you entering at market price on illiquid options contracts?
- Time Analysis: Are you holding losing trades for 4 hours but winning trades for 4 minutes?
Technical analysis says "Let your winners run." Your data will tell you if you actually do it.
3. Technical Metric to Track: MAE vs. MFE
If you want to be a technical master, stop looking at just "Net Profit" and start looking at MFE and MAE.
- MFE (Maximum Favorable Excursion): How much did the price go in your favor while you were in the trade?
- Insight: If your MFE is consistently high, but your P&L is low, your Trading Psychology is the problem—you are choking on exits.
- MAE (Maximum Adverse Excursion): How much did the price go against you before turning profitable?
- Insight: If your MAE is consistently very close to your Stop Loss, your technical entries are too early (catching a falling knife).
4. The "Fakeout" Filter
A common complaint in technical analysis is: "Breakouts always fail for me."
Do they? Or do you only remember the ones that hurt?
To fix this, you need a Visual Log.
- Upload the chart screenshot of every "Breakout" trade you take.
- After 20 trades, open your Image Gallery in TradiusPro.
- Look for the common visual theme in the losers.
You might realize: "I lose 80% of the time when I buy a breakout that happens in the first 15 minutes of the market open."
That is a technical edge you can only find through journaling.
Conclusion: Data beats Gut Feeling
You cannot improve what you do not measure. Your technical analysis might be world-class, but if your execution is flawed, your account will bleed.
Stop guessing why your trendlines aren't working. Import your trades, tag your technical setups, and let the data show you the truth.
Ready to audit your technicals? Import your Zerodha or Dhan Tradebook into TradiusPro now and visualize your edge.