The Death of Discretionary Trading: How to Statistically Validate Your Technical Setups
Drawing trendlines isn't an edge; it's just a hypothesis. Learn how to stop guessing and start using a professional analytics tool and an AI Coach to turn subjective chart patterns into hard, tradeable mathematical probabilities.
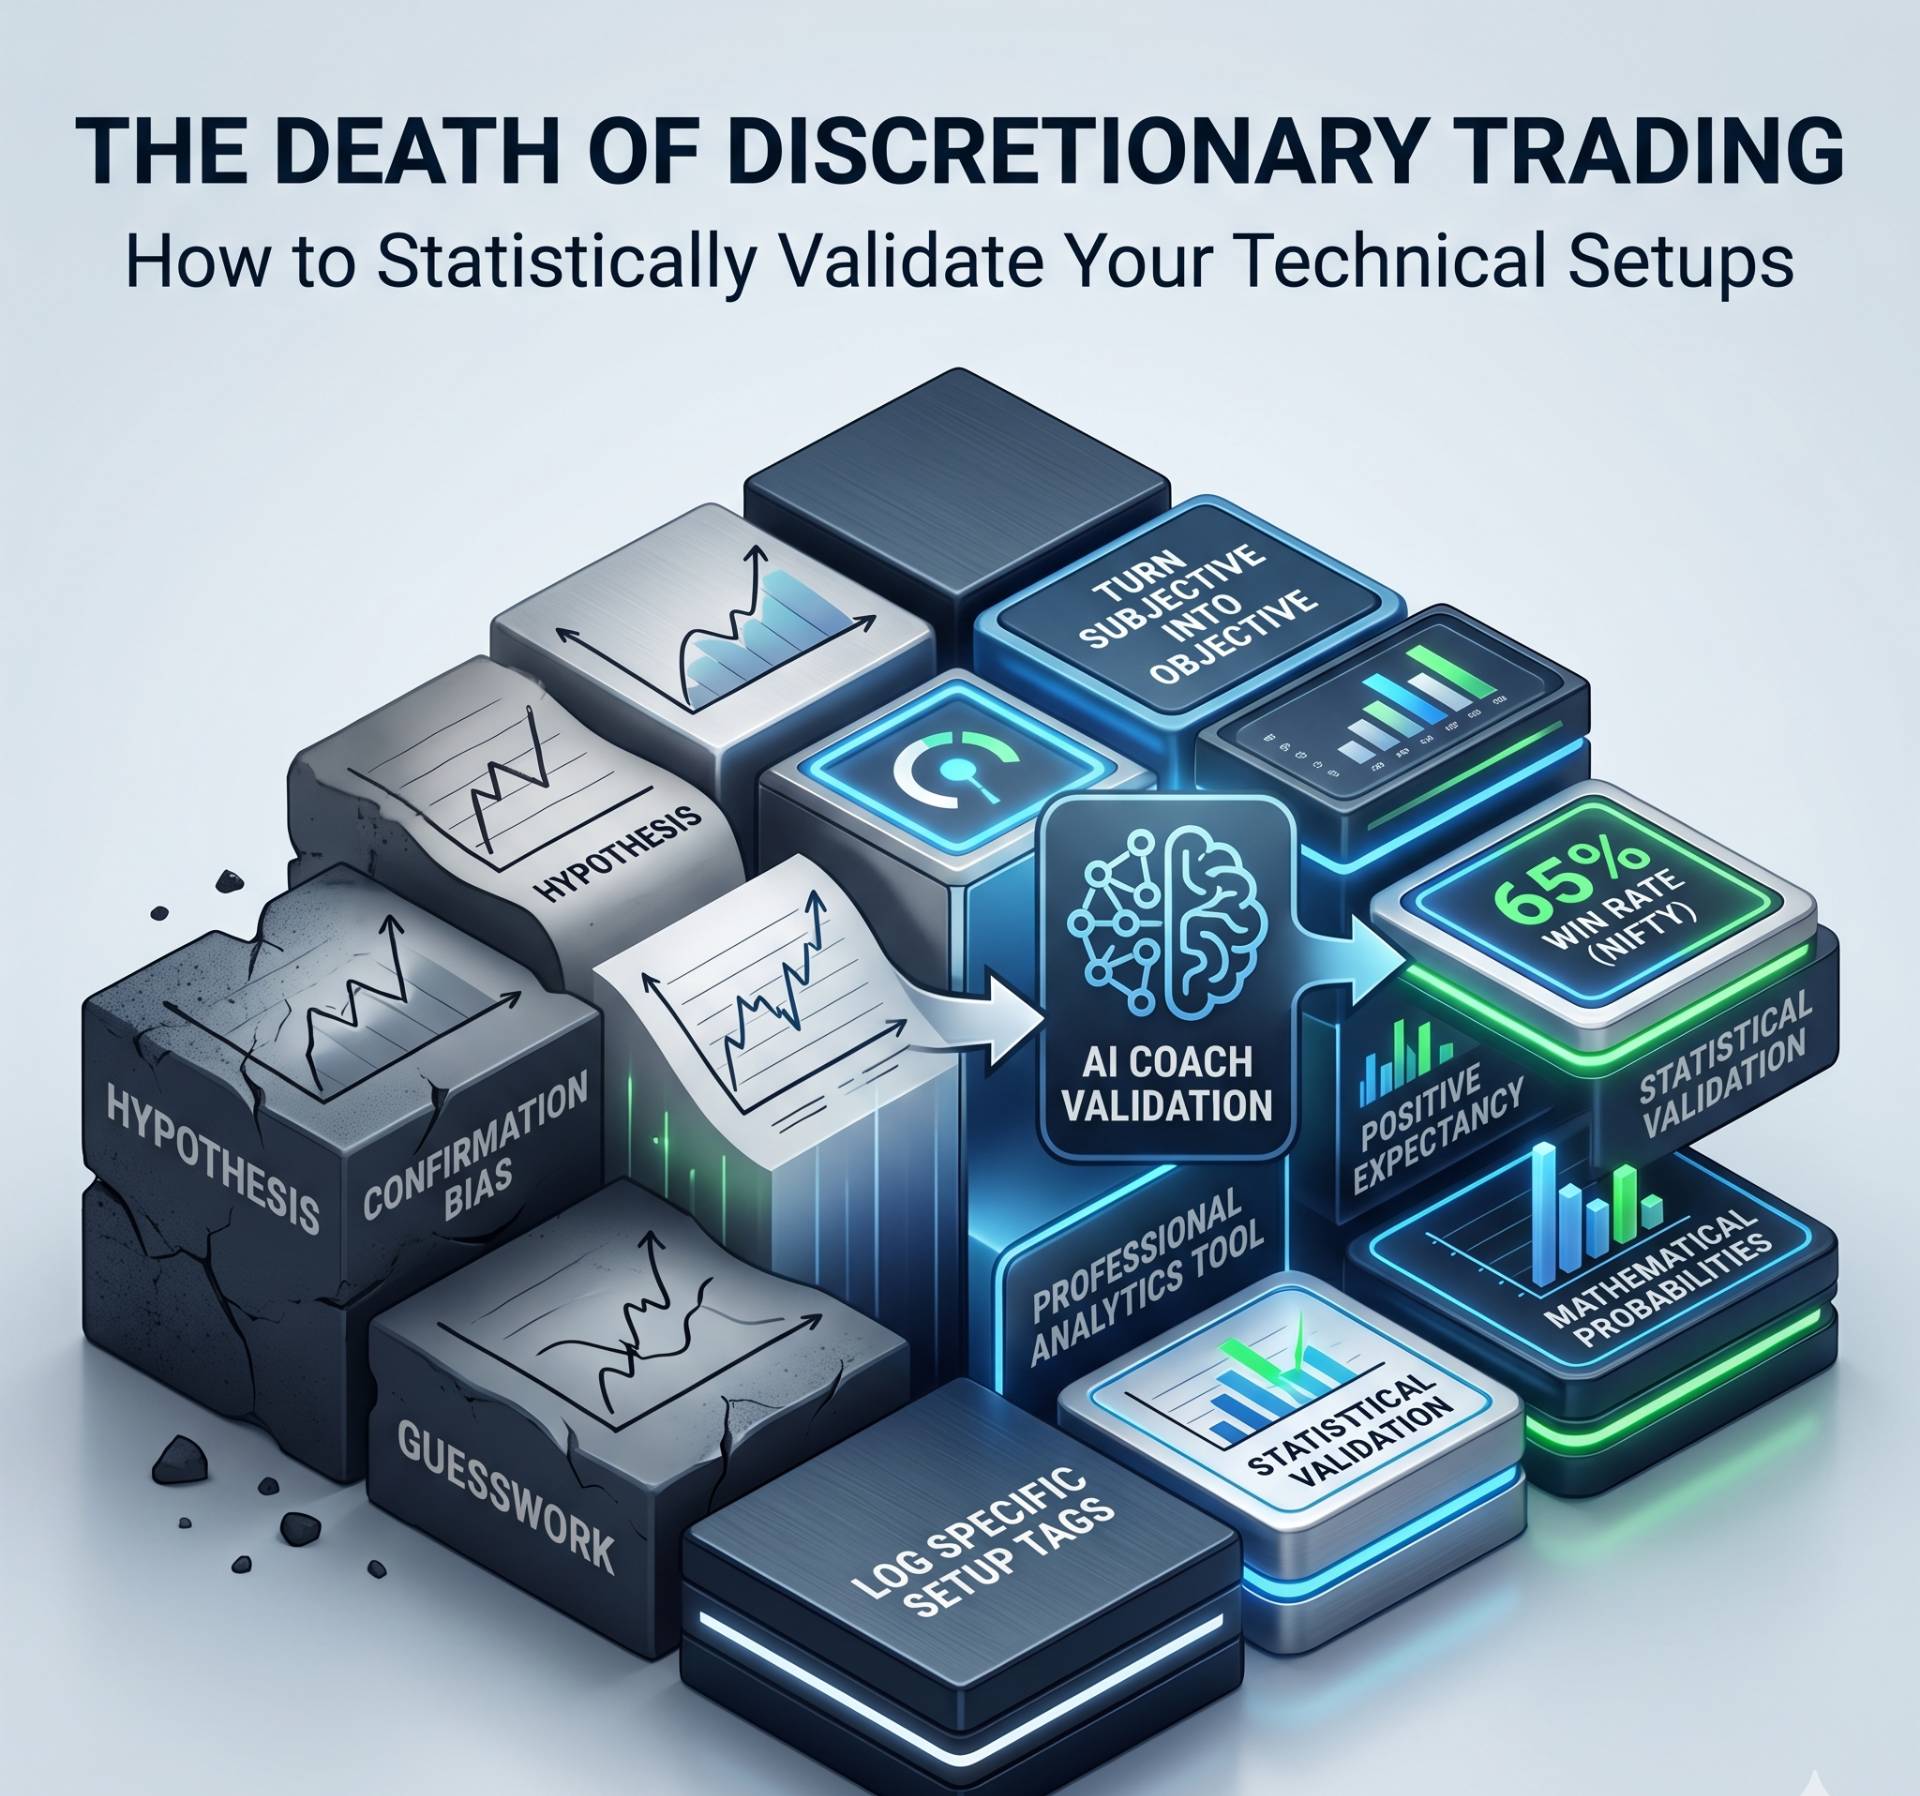
Table of Contents
Scanning sections...
The Illusion of the "Perfect" Setup
Let’s cut the fluff. Most retail traders spend their weekends meticulously drawing trendlines, marking supply and demand zones, and layering lagging indicators onto their charts. They find a "perfect" head-and-shoulders pattern in hindsight, convince themselves they have a profitable strategy, and proceed to lose money all week.
Why does this happen? Because discretionary technical analysis is riddled with confirmation bias. You only remember the times the breakout worked. You conveniently forget the eight times it faked out and hit your stop-loss.
If you do not have hard, statistical data backing up a specific technical setup, you do not have an edge. You have a guess. To become consistently profitable, you must stop treating technical analysis as an art form and start treating it as a raw data collection process.
Transforming Drawings into Hard Data
The exact picture is this: a technical setup only matters if you can consistently execute it and prove it has a positive expectancy. This requires a dedicated trading journal, not a spreadsheet or a notepad.
When you enter a trade based on a technical trigger—say, a 15-minute opening range breakout (ORB)—you must meticulously log that specific setup tag. Over 50 trades, a professional analytics tool will reveal the unvarnished truth about your analysis.
Your data might show that your 15-minute ORB setup has a 65% win rate on Nifty but only a 30% win rate on Bank Nifty. Without that objective data, you would continue bleeding capital on Bank Nifty, wrongly assuming that a breakout is a breakout regardless of the asset. The data dictates the truth; your chart drawings do not.
The Visual Autopsy: Exposing Technical Flaws
Numbers are critical, but technical analysis is inherently visual. A major flaw in amateur trading is failing to review the actual structure of the chart at the moment of execution.
A high-tier trading journal must allow for visual logging. By attaching a screenshot of your chart exactly at the moment of entry, you build a visual database of your setups. When you review your losing trades side-by-side, the patterns become glaringly obvious. You might realize that every "support bounce" you lost money on happened while the higher timeframe trend was heavily bearish.
You cannot fix a technical flaw if you cannot see it. Visual journaling bridges the gap between what you thought you saw and what the market was actually doing.
How an AI Coach Validates Your Edge
Tracking all these variables manually is nearly impossible, which is why the modern trader relies on an AI Trading Partner.
Instead of spending hours cross-referencing your chart setups with your P&L, an AI Coach instantly connects your technical tags with your execution metrics. It goes far beyond a simple win/loss ratio.
For example, your AI Coach will analyze your Maximum Adverse Excursion (MAE) for a specific setup like a "Trendline Retest." If the data shows that your MAE consistently dips heavily against you before the trade works out, the AI will alert you that your technical entries are systematically early. You aren't catching the bounce; you are catching a falling knife. The AI tells you to wait for further candlestick confirmation, saving you from unnecessary stop-outs.
Trade the Math, Not the Drawing
The market does not respect your trendlines. It only respects liquidity and order flow.
If you want to survive in this business, you must stop treating your charts like a crystal ball. Treat them as a hypothesis, and use a robust analytics tool to prove or disprove that hypothesis.
Let the amateurs argue about which indicator is the "holy grail." You need to focus on what actually pays: logging your setups, consulting your AI Trading Partner, and executing the math.