The Illusion of the Perfect Setup: Why Technical Patterns Fail Across Assets
Meticulously drawing support lines and chart patterns but still bleeding capital? Discover why a technical setup that prints profits on one asset class completely self-destructs on another.
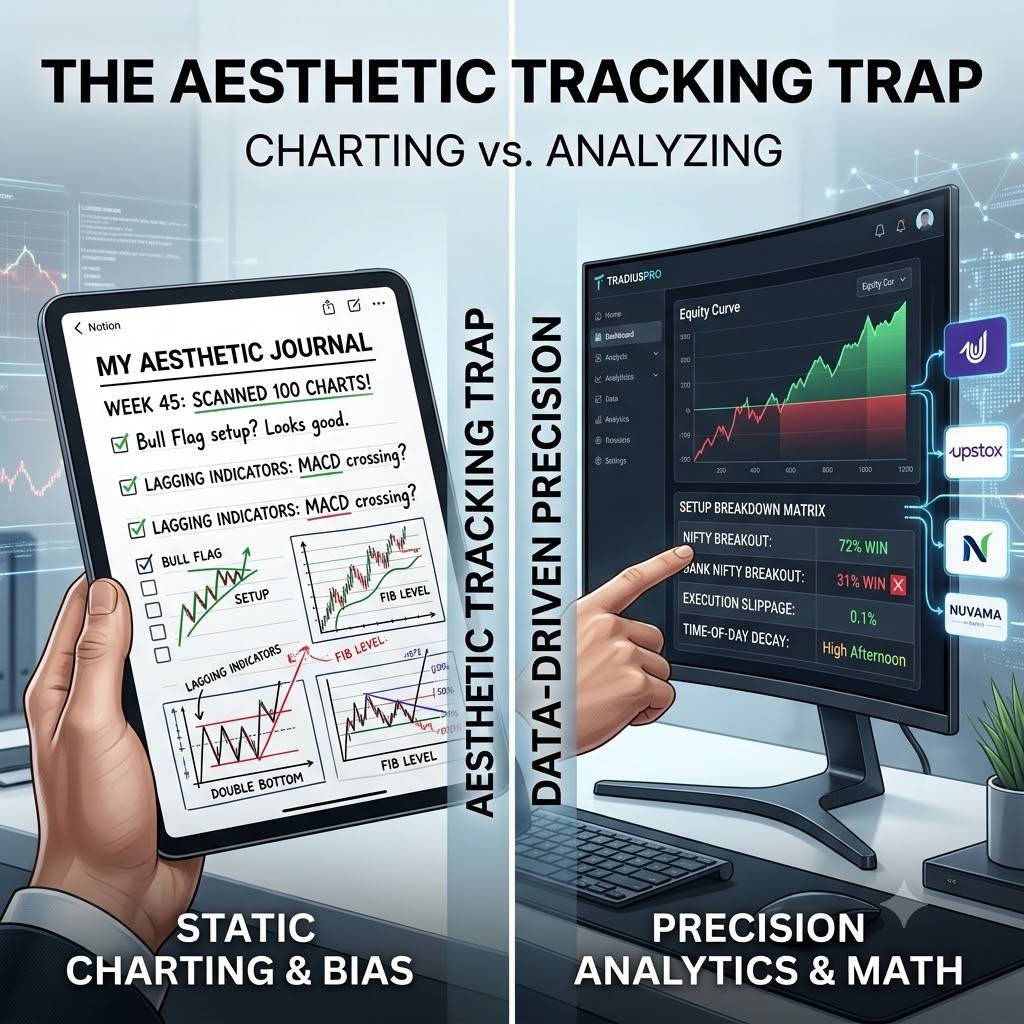
Table of Contents
Scanning sections...
The Aesthetic Tracking Trap: Charting vs. Analyzing
Thousands of retail day traders spend their weekends scanning historical charts, overlaying lagging indicators, and building an aesthetic layout inside a notion trading journal template. They download a free trading journal database, configure neat tags for "Bull Flag" or "Double Bottom," and assume that tracking the visual name of a setup is enough to build a profitable business.
This is a structural error.
Discretionary technical analysis is heavily plagued by confirmation bias. Your brain naturally remembers the single breakout that soared for a 1:3 risk-to-reward ratio while completely burying the seven times that exact same pattern faked out and hit your stop-loss. If you do not possess granular, broker-verified statistical proof of your setup’s historical win rate across individual assets, you do not have a trading edge—you have an unvalidated hypothesis.
Why a Static Notion Trading Journal Destroys Your Technical Edge
The primary bottleneck of building a manual notion trading journal database is that markdown tables cannot compute complex, multi-variable relational data. A visual pattern does not exist in a vacuum; its probability of success changes drastically depending on the underlying asset liquidity, session volume, and execution environment.
When you copy text logs by hand into a static dashboard, you miss critical execution nuances:
- Asset-Class Divergence: A tight consolidation breakout might maintain a 65% win rate on highly liquid equity setups but print a toxic 25% win rate when applied to highly volatile banking indices.
- Execution Slippage Tracking: A manual cell entry logs your ideal technical entry point. It fails to calculate the hidden slippage penalty applied when your broker order executes into thin order books during fast market sweeps.
- Time-of-Day Decay: A technical setup that functions flawlessly during the morning liquidity surge often converts into a capital-draining sideways trap during the afternoon lull.
If your tracking tool requires you to spend hours manually calculating individual metrics for every setup variant, your review loop breaks. You inevitably stop logging your worst days, leaving your technical system completely unoptimized.
Auditing Structural Execution Across Modern Broker Environments
When you are executing rapid intraday strategies across different platforms—such as managing rapid equity scalps via Upstox or routing complex derivative structures through Nuvama—data precision is your only true shield against market variance. You need an architecture that strips away human error and analyzes your technical leakage instantly.
Technical Performance Infrastructure Comparison

Eliminating Low-Probability Setups with Precision Analytics
To stop giving your profits back to the market, you must run a systematic audit on your technical setups. This requires an advanced analytical backend that does the data heavy lifting for you.
By integrating a specialized system like TradiusPro, you instantly convert raw broker logs into a predictive mathematical matrix. Instead of guessing which indicator works best, you load your execution files directly from Nuvama or Upstox and let the analytics platform isolate the math.
The engine cross-references your custom technical tags with your rolling equity curve. It reveals the unvarnished truth of your performance: for example, proving that your "Breakout" strategy prints consistently on Nifty but loses capital every time you execute it on Bank Nifty. Identifying and instantly deleting your bottom two underperforming setups can instantly transform an unprofitable trader into a disciplined, consistent earner.
Trade the Math, Stop Guessing on Patterns
The market does not care how clean your chart drawings look or how organized your markdown database is. It only respects real-time liquidity and structural mathematical probabilities.
Stop wasting your valuable cognitive energy acting as a data entry clerk inside a manual tracker. Ditch the static templates, upgrade your performance stack, and let hard numbers drive your execution choices. Leverage the TradiusPro dashboard to map your setups cleanly, delete your losing patterns, and execute your technical edge with complete algorithmic precision.