The Indicator Delusion: Why Your Strategy Fails When Market Regimes Shift
Tired of changing your technical indicators every time you hit a losing streak? Discover why a static trading journal template leaves your technical edge blind to macro volatility and how to track structural regime changes.
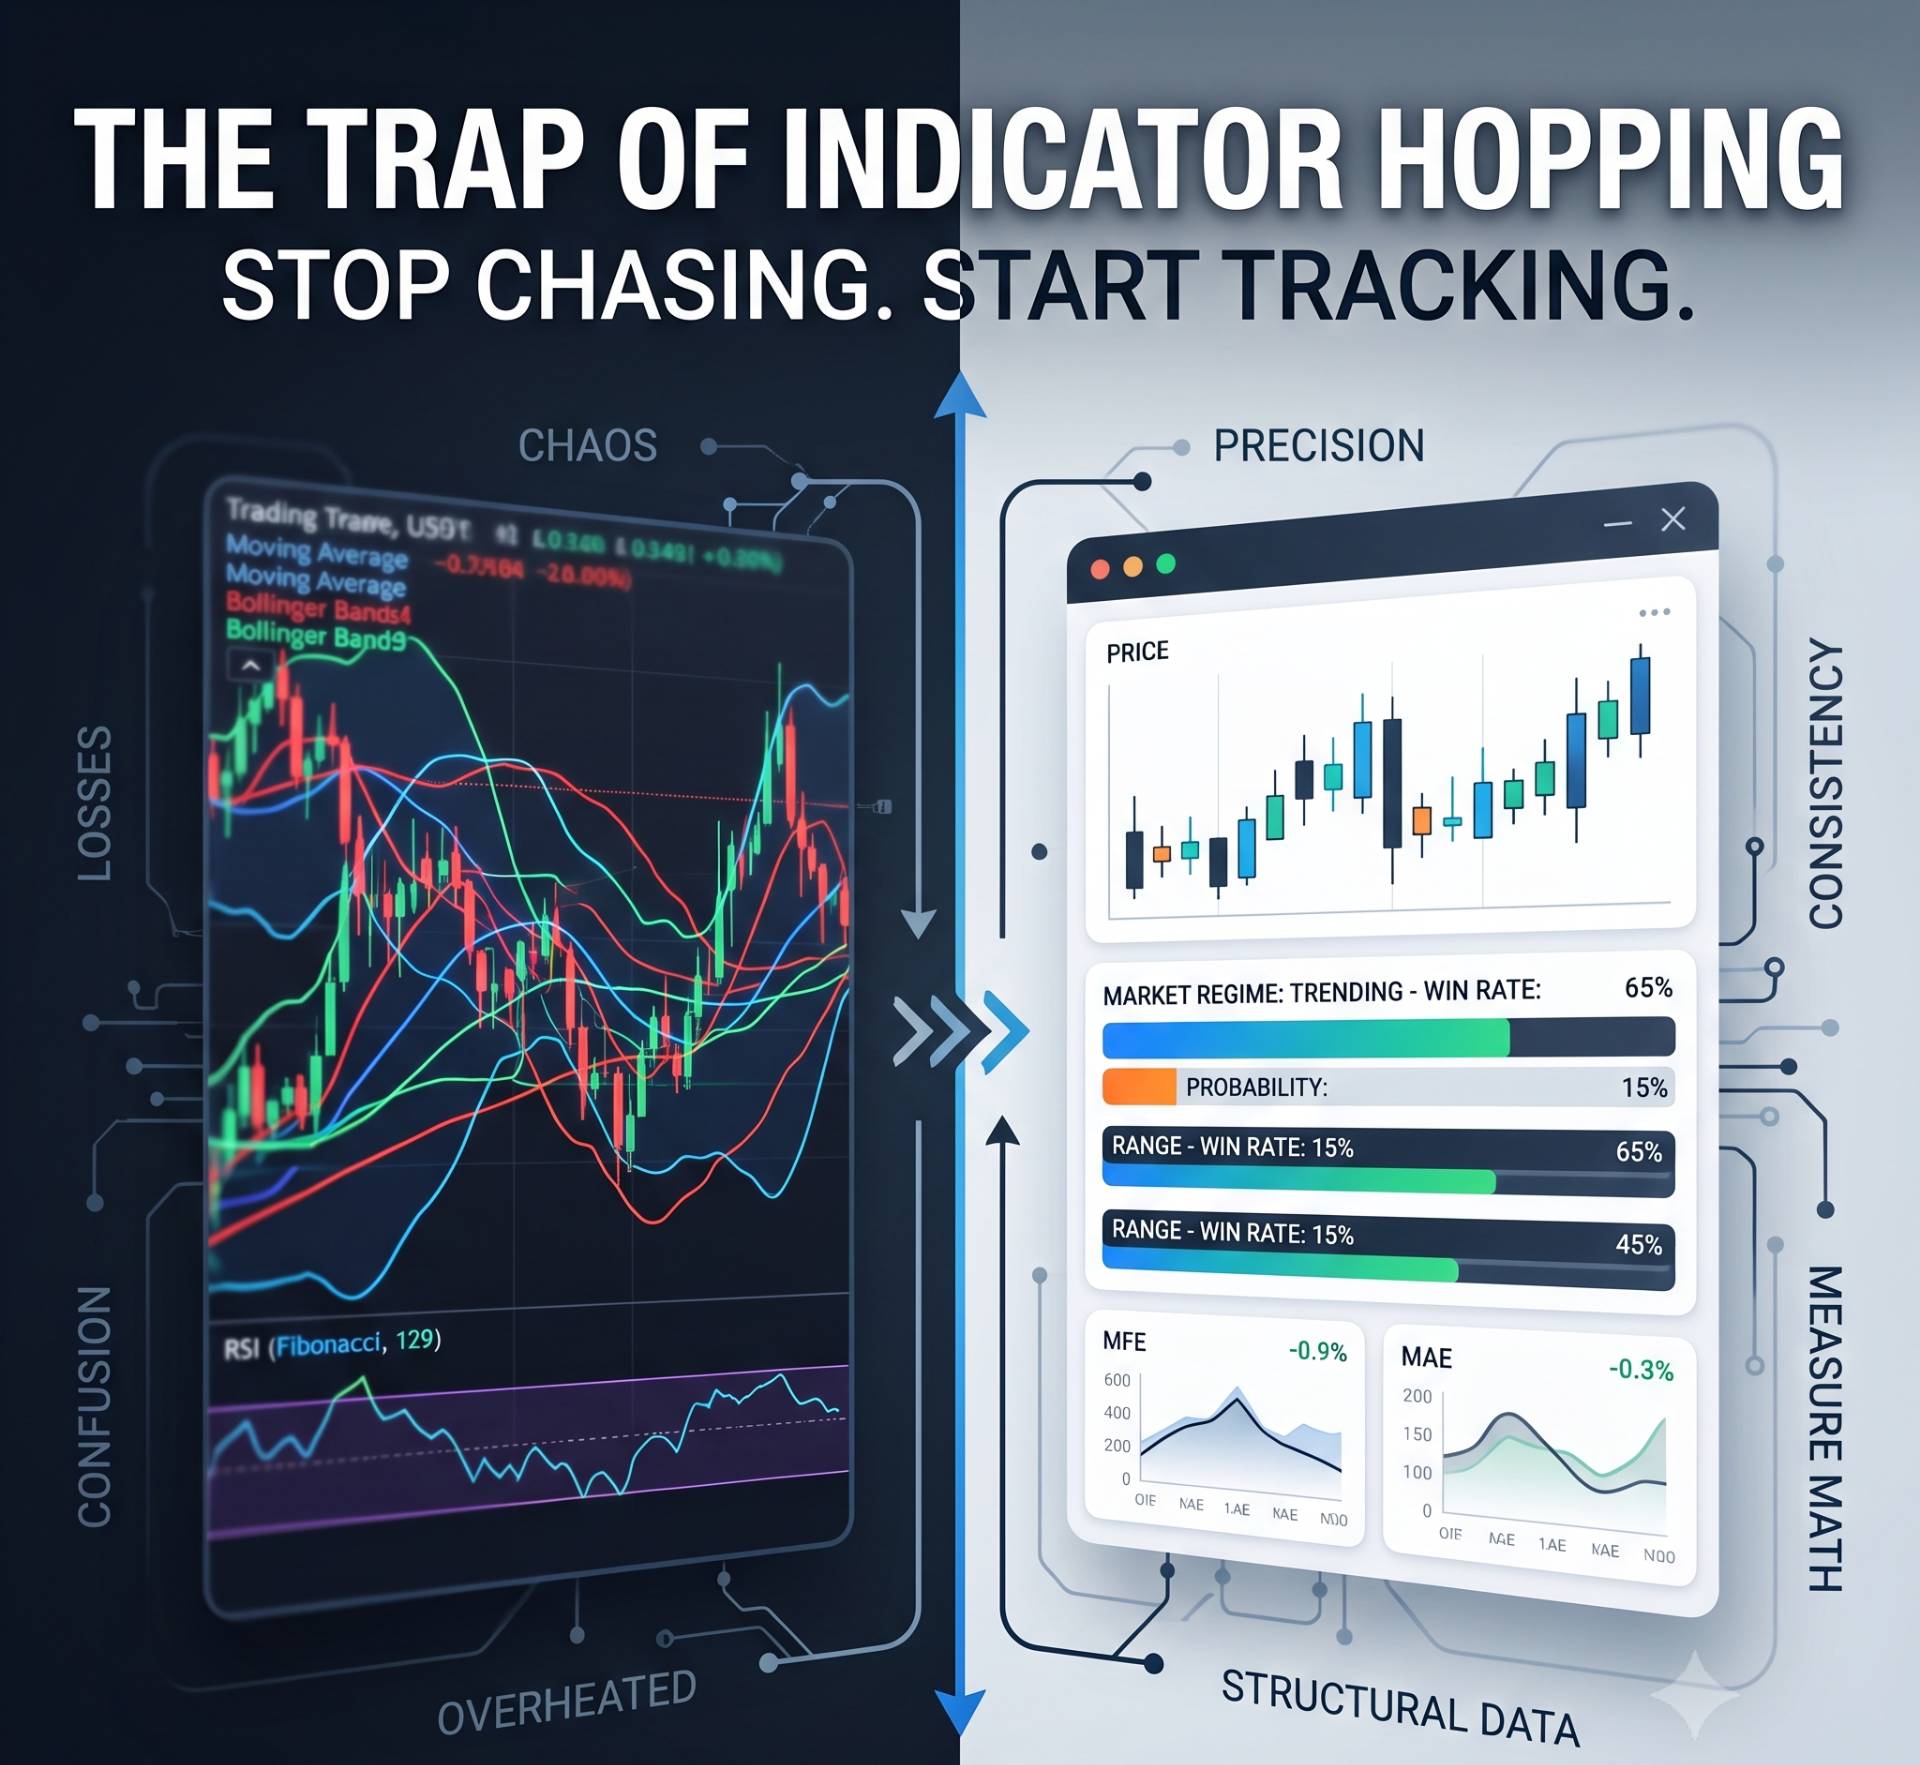
Table of Contents
Scanning sections...
The Trap of Indicator Hopping
The most common disease infecting retail day traders is the cycle of indicator hopping. You take three consecutive losses using a moving average crossover system, declare the indicator "broken," and spend your weekend scouring YouTube for a new RSI divergence strategy. You update your manual trading journal notebook, change your chart layouts, and start the process over—only to hit another drawdown two weeks later.
Let us look at the unvarnished truth: there is no holy grail indicator. Moving averages, Fibonacci retracements, Bollinger Bands, and volume profiles all work, and they all fail. They are simply mathematical derivatives of past price action designed to frame market structure.
The underlying problem is not your technical tool; it is your complete lack of structural data tracking. If you do not track your setups against changing global market regimes, your technical strategy is essentially a guessing game.
Shifting Regimes: Why a Static Trading Journal Template Breaks Down
The global financial markets are fluid, constantly cycling through distinct environments: high-volatility expansion, low-volatility compression, clean trending channels, and chaotic sideways ranges. A technical setup that prints consistent profits during a trending regime will mercilessly bleed your capital the moment the market compresses into a choppy range.
This macro shift is exactly where a rigid, manual trading journal template completely breaks down:
- Context Blindness: A traditional row-and-column layout records that your breakout trade failed. It completely fails to capture the underlying macro context, such as whether market volatility was expanding or contracting at the moment of your entry.
- Static Probability Errors: Without automated aggregation, you cannot isolate your setup's performance by market environment. You remain blind to the fact that your strategy might possess a 65% win rate in trending markets but a toxic 15% win rate in sideways ranges.
- Data Fragmentation: Attempting to manually track multi-variable parameters like macro volume spikes or session open ranges alongside your pure price action setups creates immense friction, causing most traders to drop the habit entirely.
Isolating Performance Anomalies Across Global Markets
When you are executing complex currency pairs or global macro assets using an advanced forex trading journal engine, your tracking must match the speed of the electronic markets. You cannot protect a modern capital curve using tracking methods built for the 1990s.
If you route high-frequency intraday setups through MT5 or handle fast-paced options execution via Dhan, your review framework must dynamically evaluate technical efficiency metrics like Maximum Adverse Excursion (MAE) and Maximum Favorable Excursion (MFE).
MAE tracks the exact distance a trade moves against you before turning profitable. If your broker data from MT5 or Dhan proves your MAE routinely dips deep toward your stop-loss before reversing, your entries are technically premature. You aren't catching a clean market pivot; you are catching a falling knife. A manual notebook will never surface this structural leakage.
Strategic Infrastructure: Manual Notebooks vs. Algorithmic Tracking
To run your trading like a serious business, you must upgrade your tech stack to automatically separate market noise from statistical reality.

Validating Your Technical Edge with TradiusPro
You can spend hundreds of hours trying to manually cross-reference your technical drawings with your net profit figures, or you can outsource the heavy lifting to a professional analytics system.
By upgrading your workflow to TradiusPro, you transform raw broker files into a clean behavioral mirror. The platform strips away the guesswork by mapping your exact execution parameters directly against your custom technical tags.
Instead of guessing whether a strategy is working, you pull your trade history from brokers like Dhan or MT5 and let the analytics dashboard isolate the math. The engine calculates your exact profit factor across different assets, proving precisely where your technical edge excels and where it leaks capital. Eliminating the asset classes and environments where your setups possess a negative mathematical expectancy is the fastest, most direct path to sustainable consistency.
Clean Your Screen, Measure Your Math
The market does not respect your colorful chart drawings or your subjective opinions. It only respects liquidity, order flow, and structural probabilities.
Stop switching indicators every time you encounter normal market variance. Keep your charts clean, commit to a single framework, and track its execution metrics with absolute discipline. Use the TradiusPro dashboard to audit your setups, isolate your winning regimes, and run your technical execution with machine-like precision.