The Indicator Trap: Why You Don't Need Better Charts, You Need Better Tracking
Stop switching your indicators every time you hit a losing streak. The problem isn't your moving average; the problem is you don't track your technical setups. Learn how to audit your technical edge using hard data.
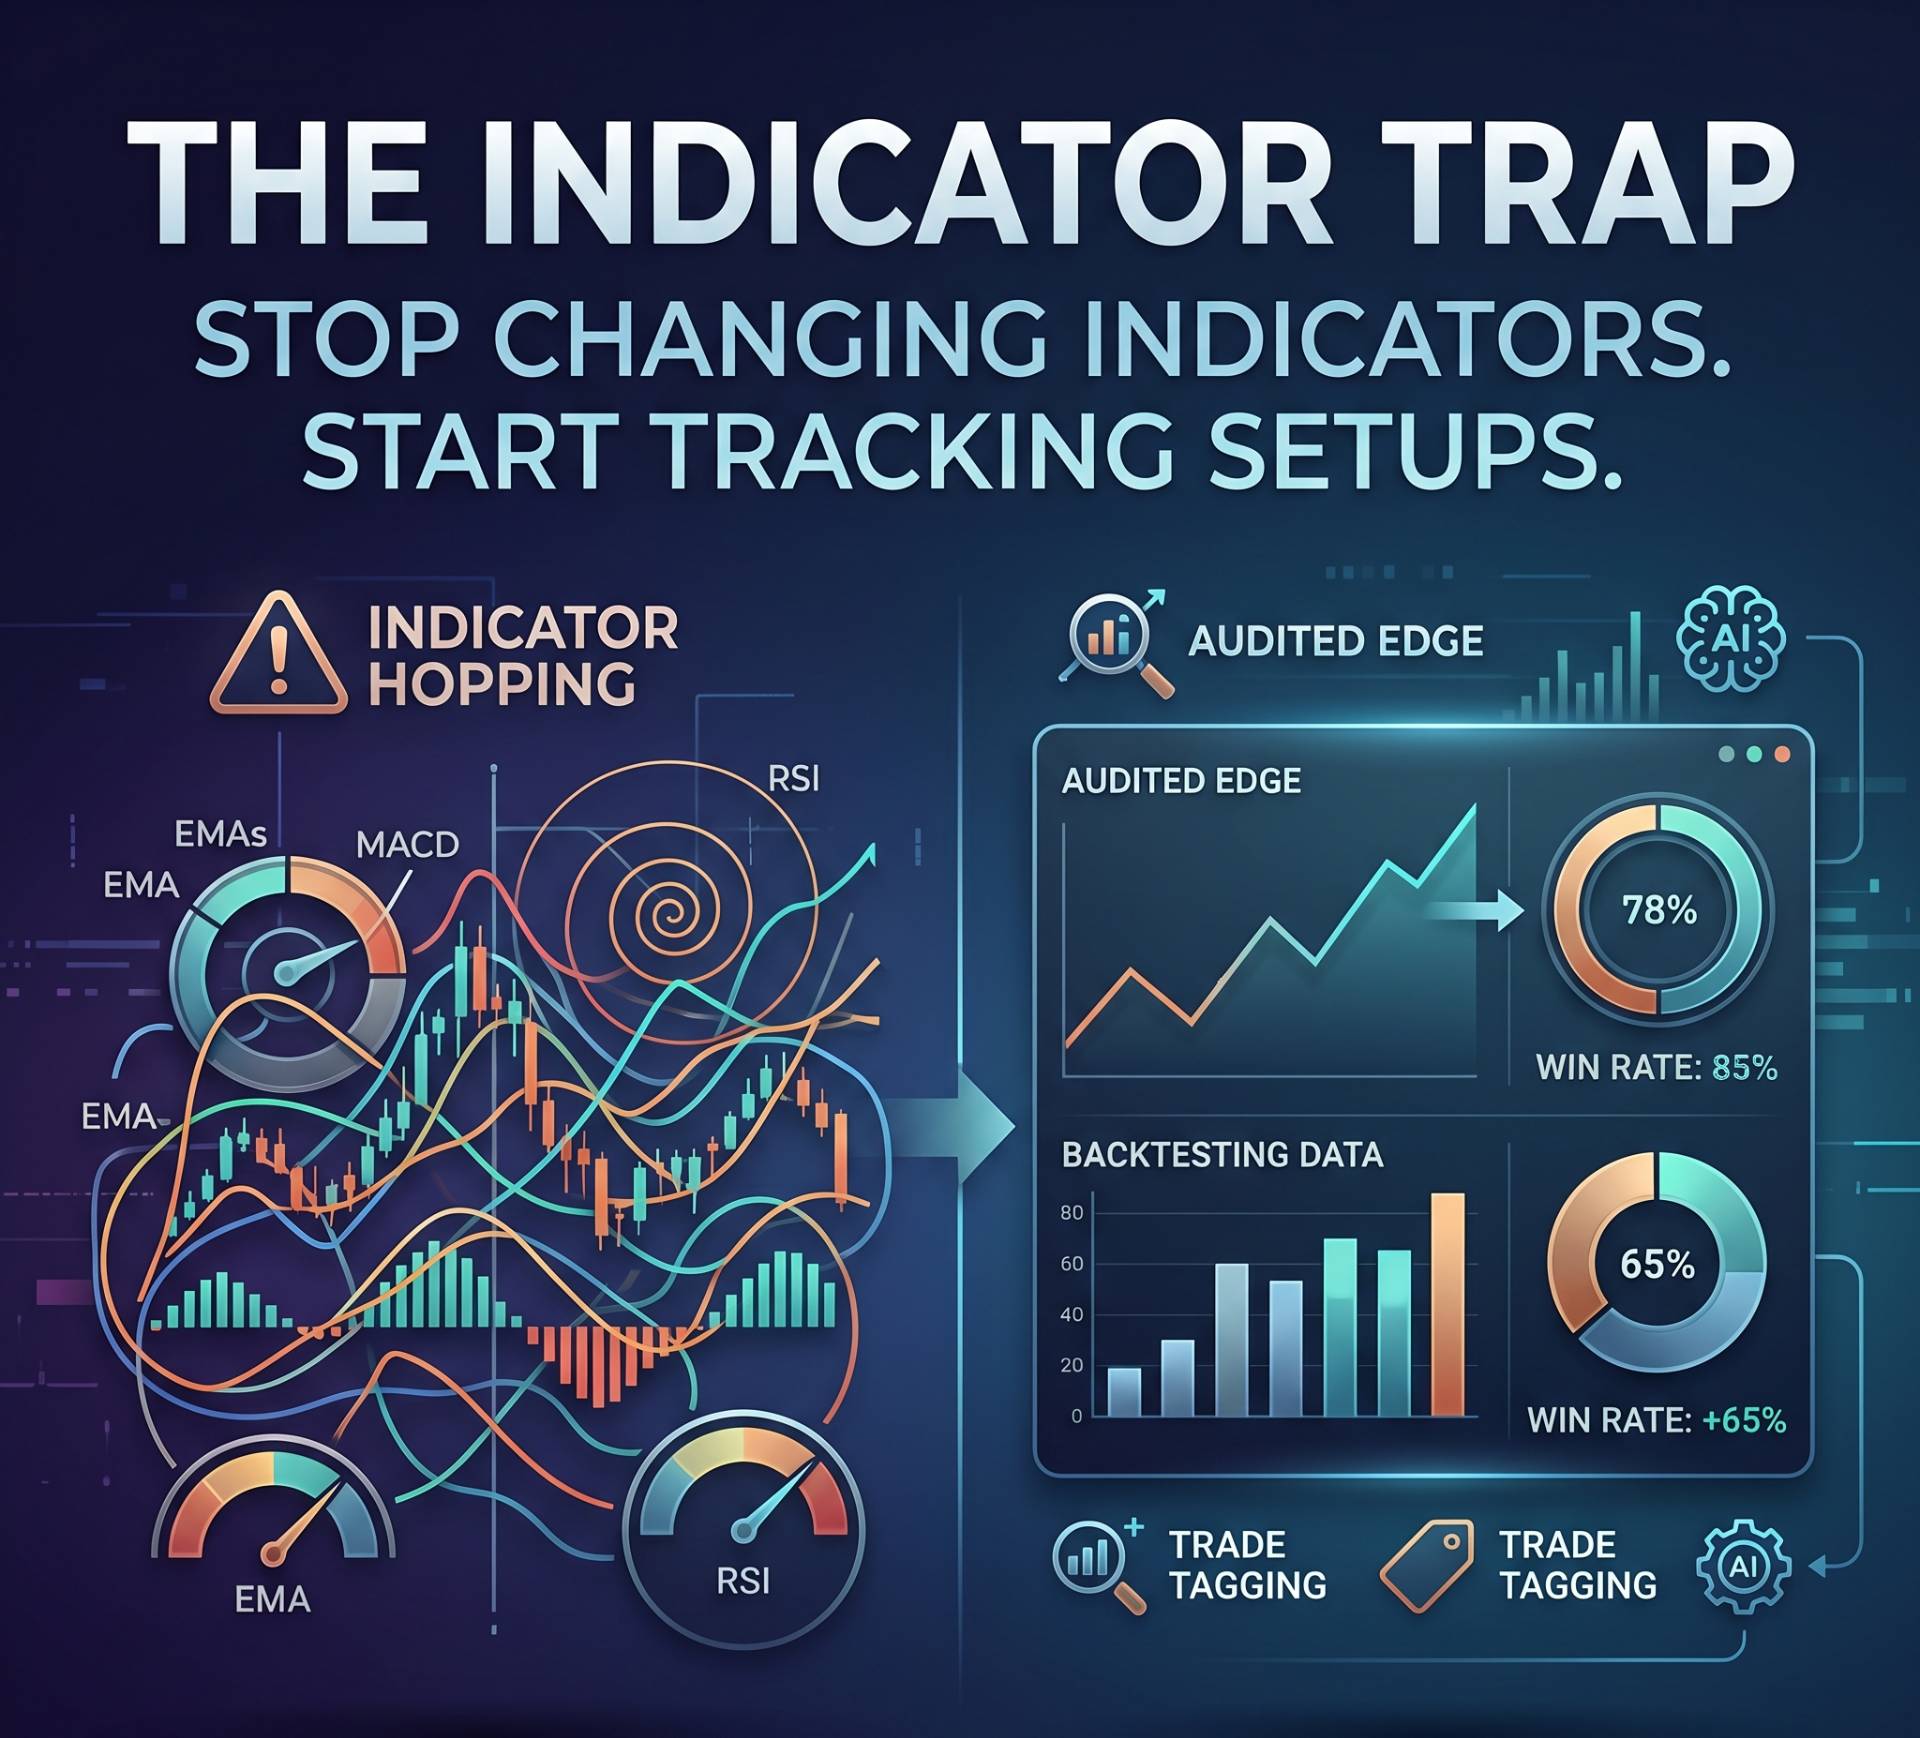
Table of Contents
Scanning sections...
The Holy Grail Delusion
Let’s address the most common disease among retail traders: "Indicator Hopping." You take three losses using a MACD crossover strategy, so you declare the MACD "broken." You spend the weekend watching YouTube videos, switch to an RSI Divergence strategy, and the cycle repeats.
Here is the exact picture as it is: there is no holy grail indicator. Moving averages, Fibonacci retracements, and volume profiles all work, and they all fail. They are just tools to frame price action. If you are constantly losing money, your technical analysis isn't necessarily wrong; your understanding of its statistical probability is nonexistent.
You do not need a better chart. You need a rigorous trade backtesting and journaling tool to figure out exactly when and where your current technical setups actually work.
Automated Trade Tagging: Building Your Edge
If you cannot tell me the exact win rate of your "Support Bounce" setup over the last 100 trades, you do not have an edge. You are just guessing with colorful lines.
To turn technical analysis into a profitable business, you must categorize your executions. This is where a trading journal Excel alternative becomes mandatory. Spreadsheets make tracking multiple variables a nightmare. By upgrading to the best trading journal app 2026, you unlock automated trade tagging.
Every time you execute a trade, you tag the technical trigger (e.g., "VWAP Breakout" or "Daily Resistance Reject"). Over time, the software aggregates this data. You might be shocked to discover that your "Trendline Break" strategy has a 70% win rate, but your "Reversal Catching" strategy has a 20% win rate and is quietly destroying your entire account.
Context Matters: Why Setups Fail Across Assets
A fatal flaw in discretionary technical analysis is assuming a pattern works equally well across all markets.
A tight consolidation breakout might work beautifully if you are using a Forex trading journal auto import to track the EUR/USD during the London session. But if you apply that exact same technical setup to a highly manipulated, volatile index in the morning session, you might get chopped to pieces.
This is why serious Indian traders use a dedicated Nifty options trading journal. By feeding your raw execution data into the system via a Zerodha trading journal import, you can filter your technical setups by asset. The data will show you the brutal truth: maybe your breakout strategy is world-class on Nifty, but absolutely toxic on Bank Nifty. Without that granular data, you will keep giving your Nifty profits back to the banking index.
The Visual Autopsy
Technical analysis is visual, which means your review process must also be visual. Numbers will tell you that a setup failed, but they won't always tell you why.
The most elite platforms allow you to attach chart screenshots directly to your execution data. When you look at an image gallery of your last 20 failed "Bull Flags," the pattern becomes obvious. You will realize you are buying flags when the higher timeframe is deeply bearish. You aren't trading the technicals; you are trading against the macro trend.
Validating the Math with Trading Journal AI
You can spend hundreds of hours trying to cross-reference your technical setups with your P&L, or you can outsource it to a machine.
By integrating trading journal AI into your workflow, you get an immediate audit of your technical edge. The AI trading coach looks at your tags and cross-references them with your MAE and MFE trading analytics. If you tag a trade as a "Perfect Breakout," but your MAE shows the trade went deep into the red before working out, the AI will tell you the truth: your entry timing was actually terrible, and you just got lucky.
Stop painting your charts with useless indicators. Clean up your screen, import your data into TradiusPro, and let the math dictate your technical edge.