The Brutal Truth About Technical Analysis: Stop Painting Your Charts and Start Trading
Technical analysis isn't a magic crystal ball; it's a probability matrix. Stop cluttering your screen with lagging indicators and learn the harsh reality of price action, execution, and why your trading journal is your only real edge.
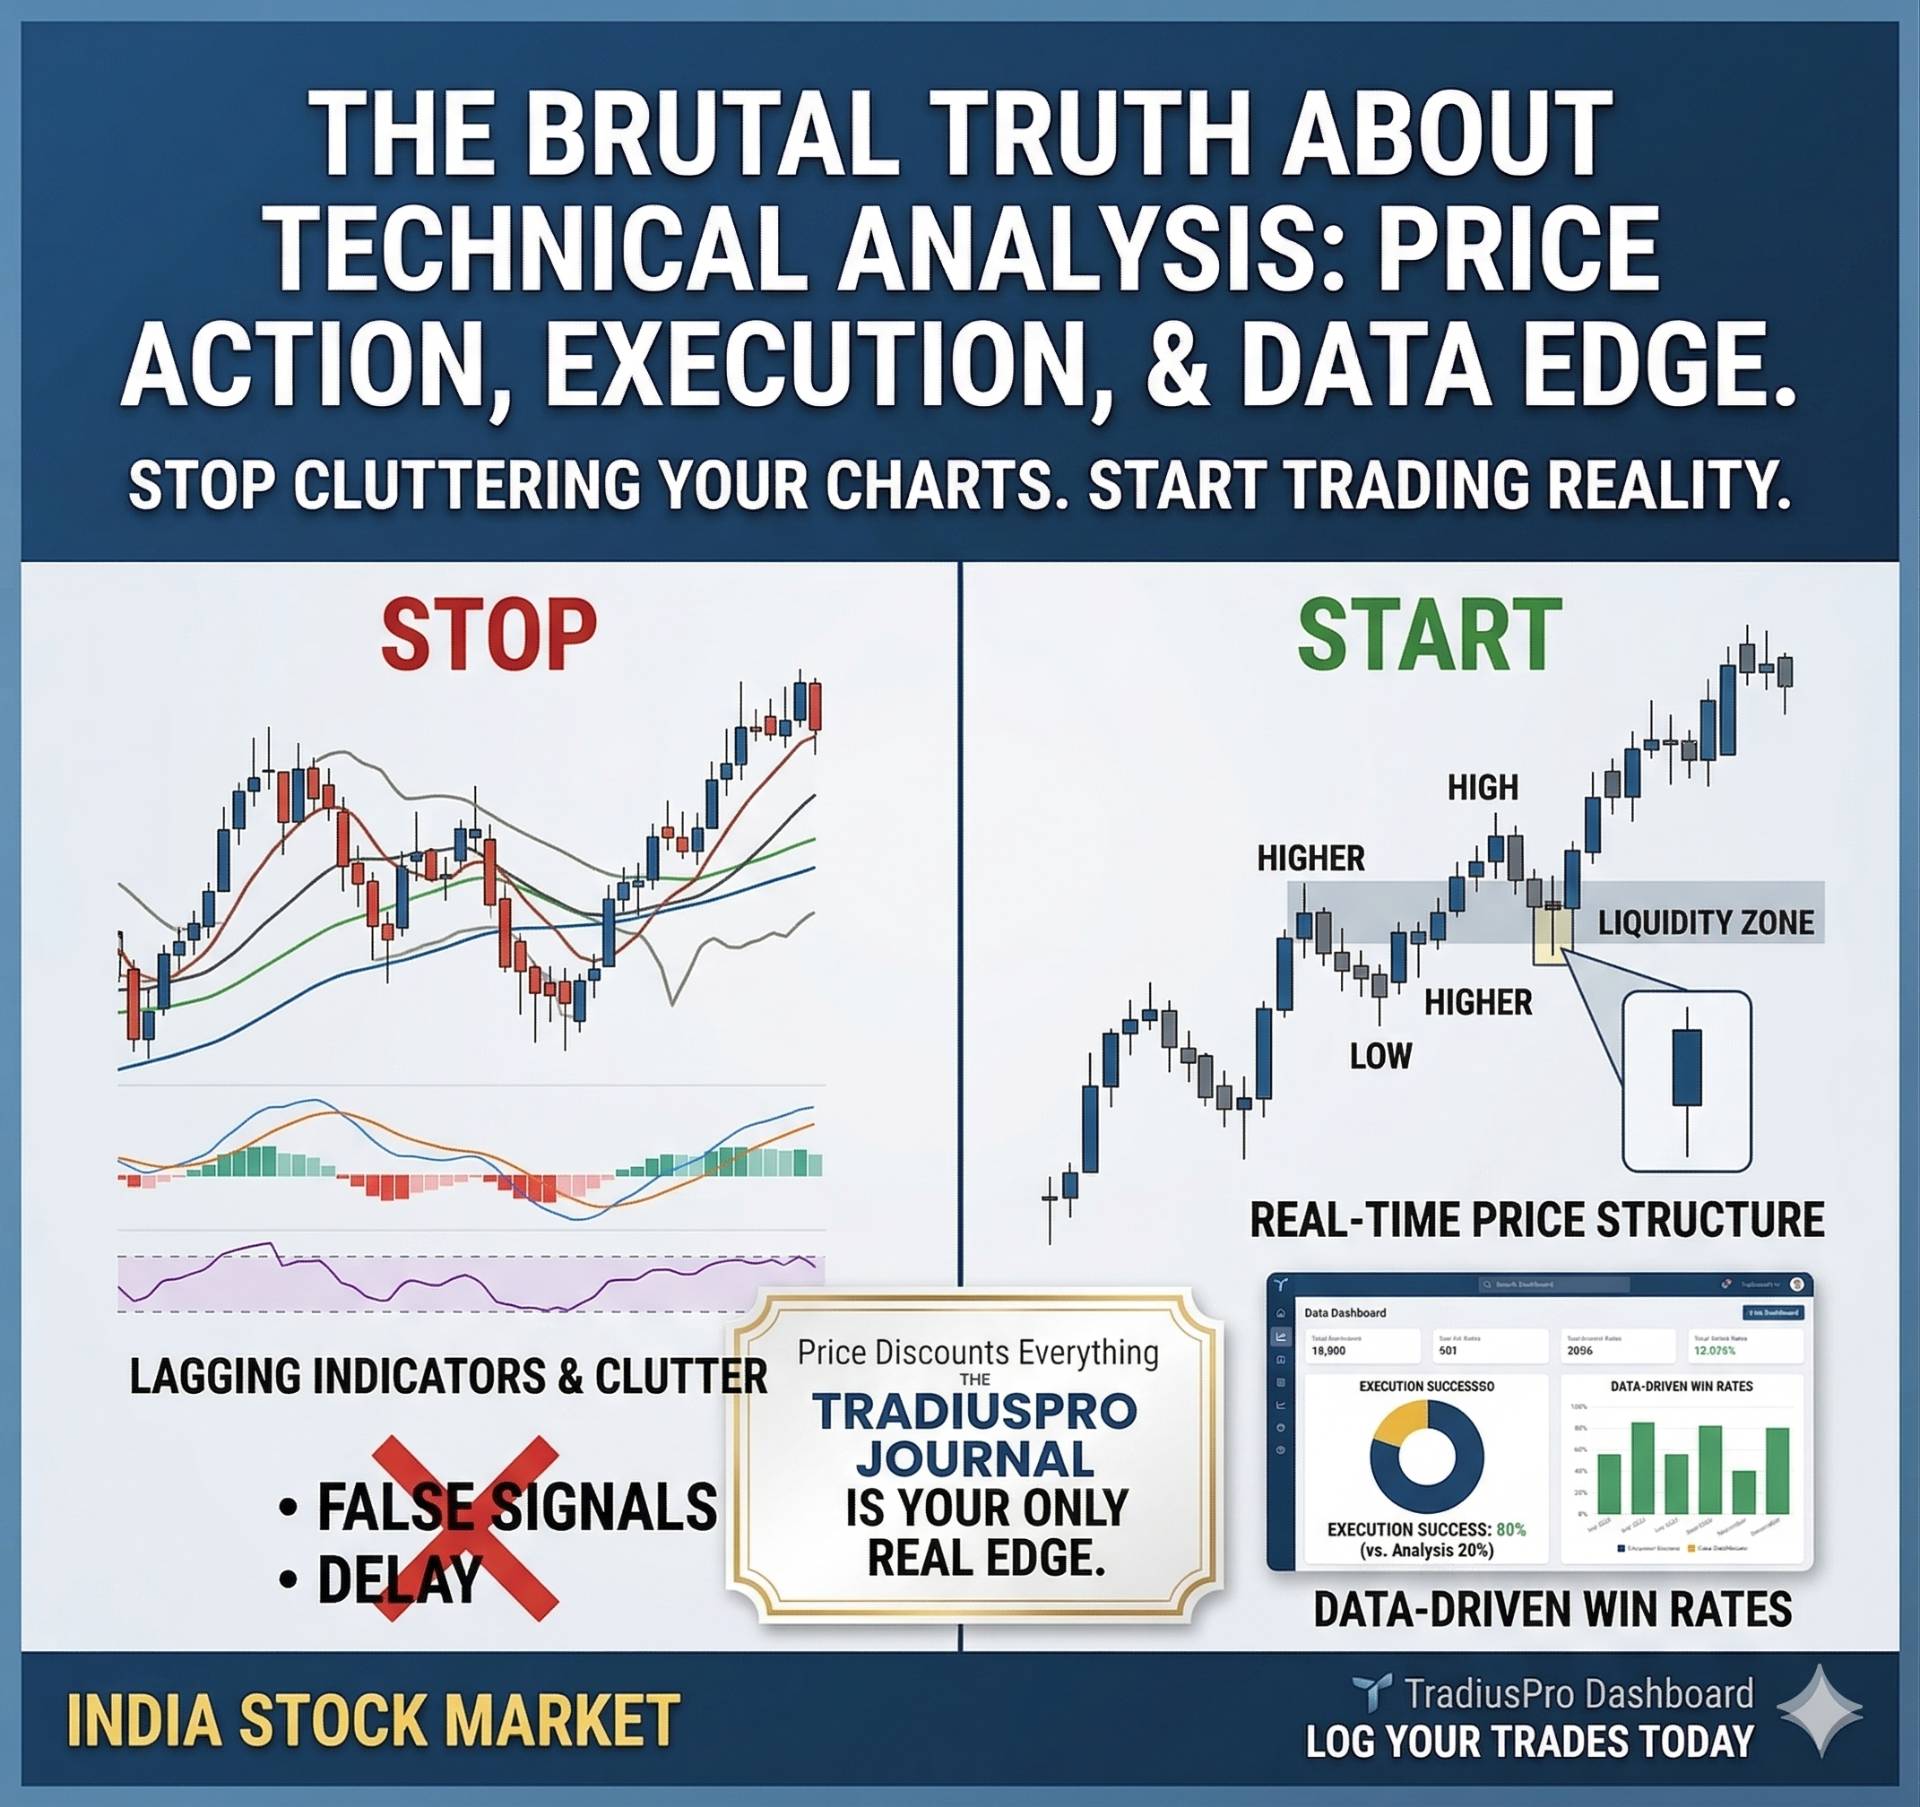
Table of Contents
Scanning sections...
The Illusion of Prediction
Let’s cut the fluff: drawing fifteen colorful lines and layering five indicators on your chart does not make you a professional trader. It makes you a confused gambler with a messy screen.
Technical analysis is not a prediction tool. The exact picture, as it is, is that technical analysis simply studies historical price and volume to identify repeating patterns. The golden rule of this discipline is that "Price Discounts Everything". This means all known information, from corporate earnings to economic rumors, is already reflected in the current market price. It tells you what has happened, giving you a slight probability edge on what might happen.
If you are losing money despite having "perfect" technical setups, it's because you misunderstand the core realities of the game.
1. Indicators Lag. Price Action is Real-Time.
The biggest trap retail traders fall into is searching for the holy grail indicator.
- The Reality: Moving averages, MACD, and RSI are derivatives of past data. Many technical tools are based on historical price data, meaning their signals often trigger after a trend has already started. Indicators inherently lag, which can create false signals and unnecessary chart complexity.
- The Fix: Strip your chart. The market speaks in price, and price action is how you listen. Market structure, such as identifying an uptrend by its sequence of higher highs and higher lows, is the only real-time truth. A clean candlestick tells you exactly who is in control without the delay.
2. Support and Resistance Are Liquidity Zones, Not Brick Walls
Amateurs draw a single horizontal line at ₹26,000 on Nifty and expect the market to bounce off it perfectly.
- The Reality: Support and resistance are simply price zones where buying or selling pressure tends to accumulate. They are areas of interest, not precise, impenetrable barriers. The market will frequently spike through your lines to hunt stop-losses before reversing.
- The Fix: Stop blindly placing limit orders at exact lines. Wait for the price to reach the zone and observe the candlestick reaction. Look for clear clues, like a pin bar showing a long wick and a small body, which indicates that the price was aggressively pushed away from that level.
3. The Execution Gap: Analysis is 20%, Execution is 80%
You called the breakout pt.erfectly. You knew the target. But you either entered too late out of FOMO or exited too early because you were scared of losing a small profi
- The Reality: Having a good chart means nothing if your psychology is weak. Technical indicators and patterns can sometimes produce misleading signals, especially in volatile or sideways markets. If you trade your emotions instead of the chart, the setup is irrelevant.
- The Fix: Your technical edge is void if your risk management is broken. Separate the setup from the outcome. Define your absolute maximum risk before the trade and stick to it mechanically.
4. Data is Your Ultimate Indicator
If you trade a specific chart pattern, do you actually know your personal win rate with that setup? If not, you are guessing.
- Technical analysis only works if you have statistical proof that you execute it profitably.
- The Fix: Stop guessing and start logging. You need to import your Zerodha or Dhan tradebook into a professional journal like TradiusPro.
- Tag every single trade with your technical setup (e.g., "Resistance Breakout").
- Let the analytics show you the unvarnished truth. You might discover that you lose money 80% of the time when you buy a breakout in the first 15 minutes of the open. That is a technical edge you only find through hard data, not a textbook.
Conclusion: Trade the Reality, Not the Drawing
The market is a harsh instructor. It will brutally punish those who rely on lagging indicators and ignore execution discipline.
Clean up your charts. Focus on pure price structure. Stop treating technical analysis like a fortune teller and start treating it like a business metric. Log your trades on the TradiusPro Dashboard today and let your data dictate your edge.